Portfolio Details
Project Information
- Category: Data Analytics and Dashboard Development
- Client: Self-Directed project
- Project date: Aug, 2025
Project Overview
This dashboard project, "Alchemist Retail", was built to provide comprehensive business intelligence for a retail company. The goal was to analyze sales and operational performance across different dimensions, from high-level financial KPIs to granular product and customer insights. This was accomplished by using SQL Server for data extraction,PowerQuery for data cleaning, Power BI for modeling and interactive reporting, and DAX for advanced calculations. The dashboard is designed to be interactive and visually intuitive, allowing stakeholders to quickly understand key trends and make informed decisions.
Key Features
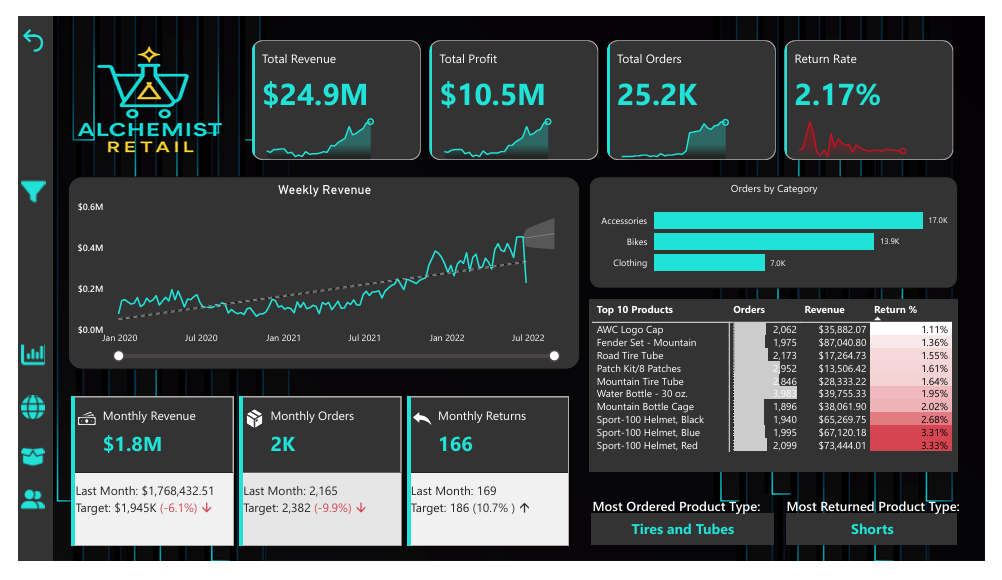
Executive Performance Summary
Displays core business metrics such as total revenue, total profit, total orders, and return rate at a glance, with dynamic charts showing weekly and monthly trends against set targets.
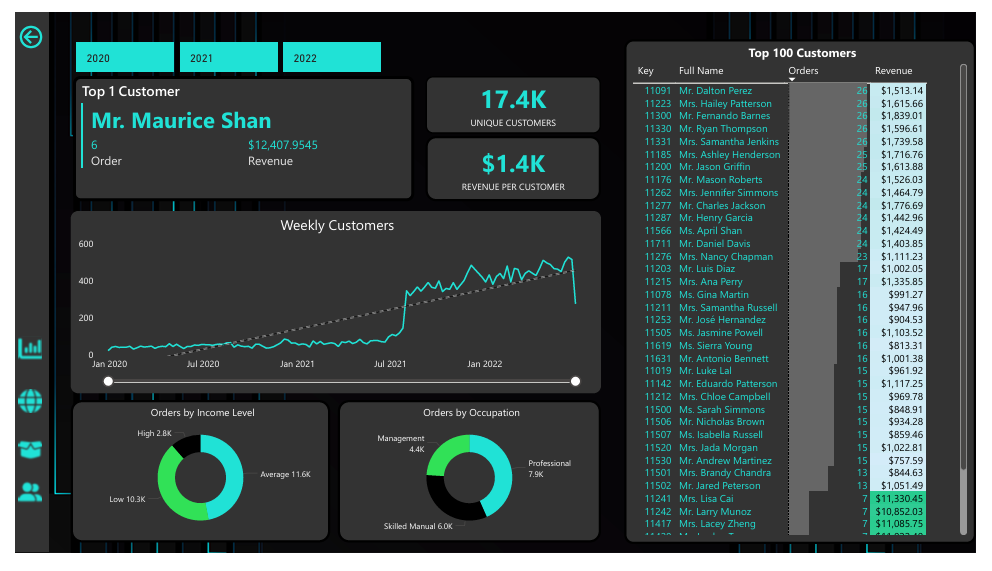
Advanced Customer Insights
Analyzes customer behavior by income level and occupation. It also identifies top customers by revenue and orders, providing a detailed view of the customer base.
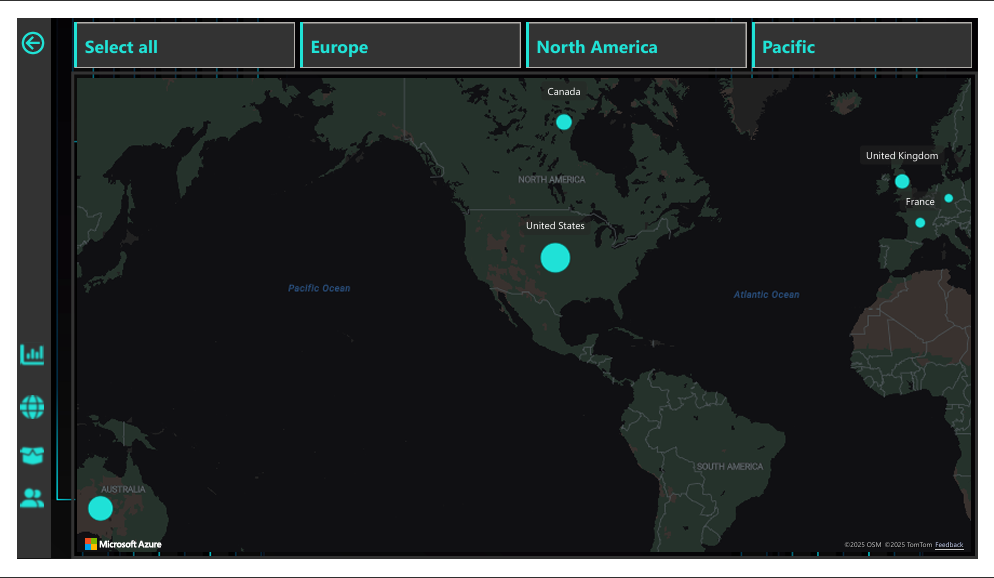
Geographic Sales Analysis
Utilizes an interactive world map to visualize sales distribution across key regions like North America, Europe, and the Pacific, highlighting the company's strongest markets.
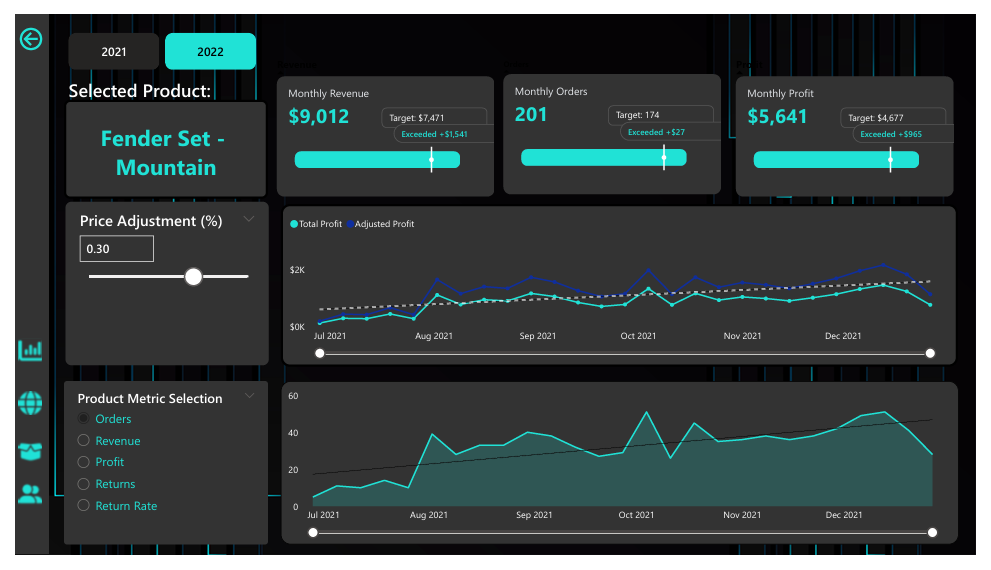
Product Performance & Pricing Simulation
Provides a detailed, product-specific view that allows for a simulated price adjustment. This feature shows the potential impact on profit, helping to guide pricing strategy for individual products.