Portfolio Details
Project Information
- Category: Business Intelligence & Data Visualization
- Client: Internal project
- Project date: Aug, 2025
Project Overview
This dashboard is a comprehensive business intelligence tool designed to provide a deep analysis of global sales and profitability. The report's purpose is to empower stakeholders to make data-driven decisions by offering a complete view of the business, from high-level financial metrics to granular performance details. The dashboard is interactive, allowing users to navigate through different views to understand sales trends, customer behavior, and the performance of specific product categories.
Key Features
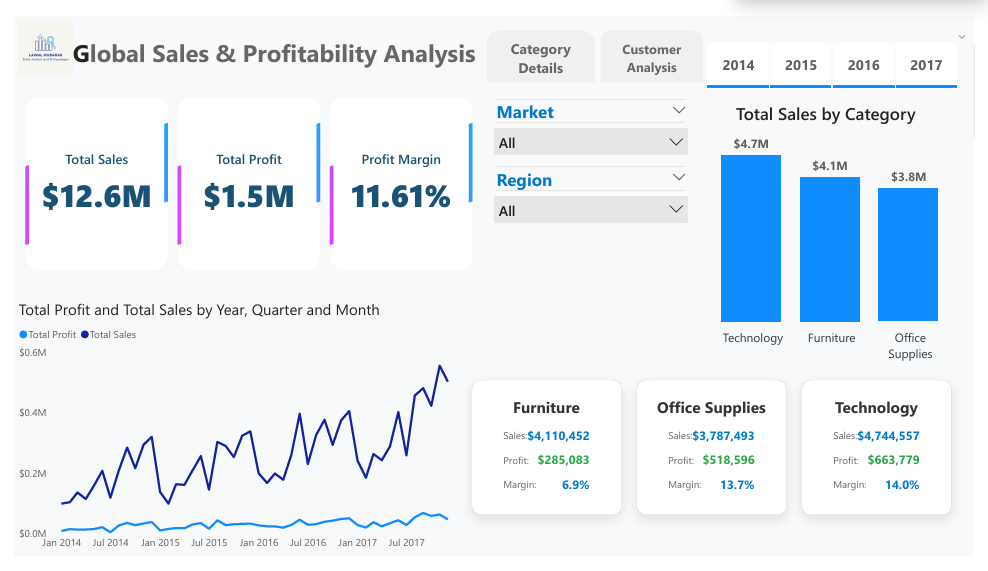
Comprehensive Financial Overview
Displays key performance indicators (KPIs) like total sales, total profit, and profit margin at a glance, along with a detailed timeline of sales and profit trends.
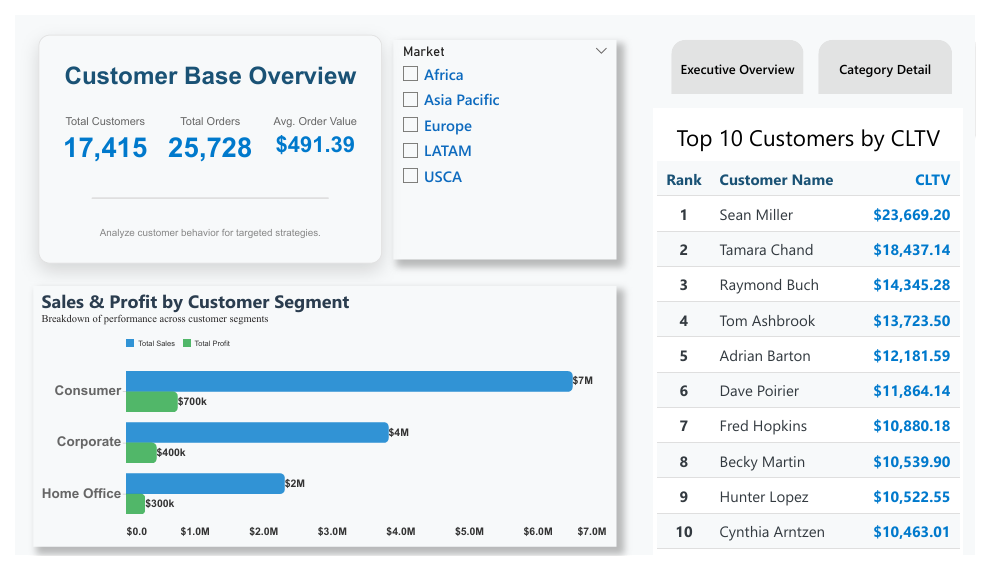
Dynamic Category & Customer Analysis
Provides the ability to filter and analyze performance by product category (Technology, Furniture, Office Supplies) and break down key metrics by customer segment (Consumer, Corporate, Home Office).
Interactive Data Visualization
Utilizes a variety of visual elements, including bar charts, line graphs, and a world map, to present complex sales data in an accessible and engaging format, making it easy to identify trends and top-performing areas.
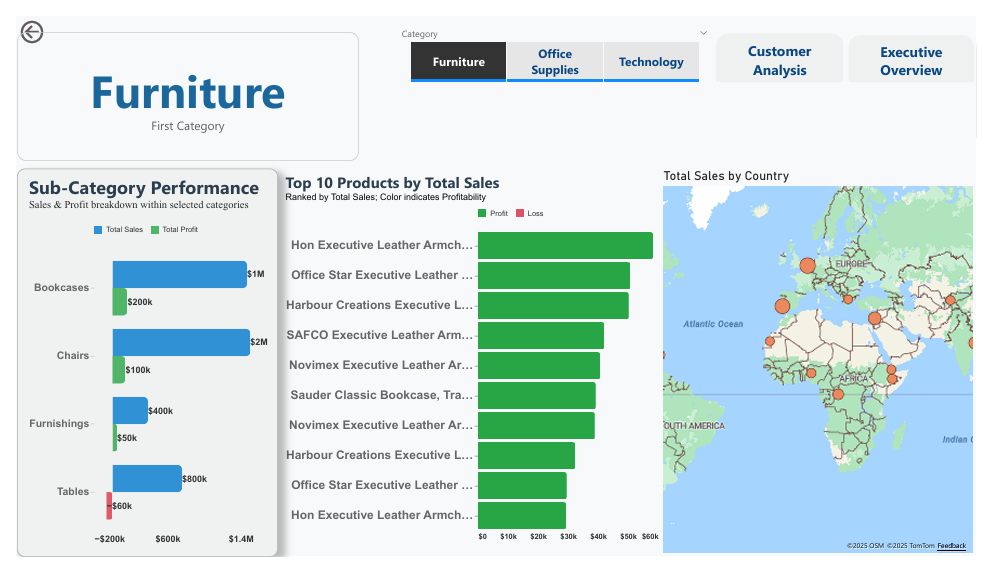
Granular Performance Breakdown
Allows for a detailed drill-down into specific categories, showcasing performance at the sub-category level, identifying top-selling and most profitable products, and pinpointing geographical sales hotspots.