Portfolio Details
Project Information
- Category: Data Analytics / Excel Dashboard
- Client: Self-Directed Project
- Project date: March, 2025
- Project URL: view live dashboard
Project Overview
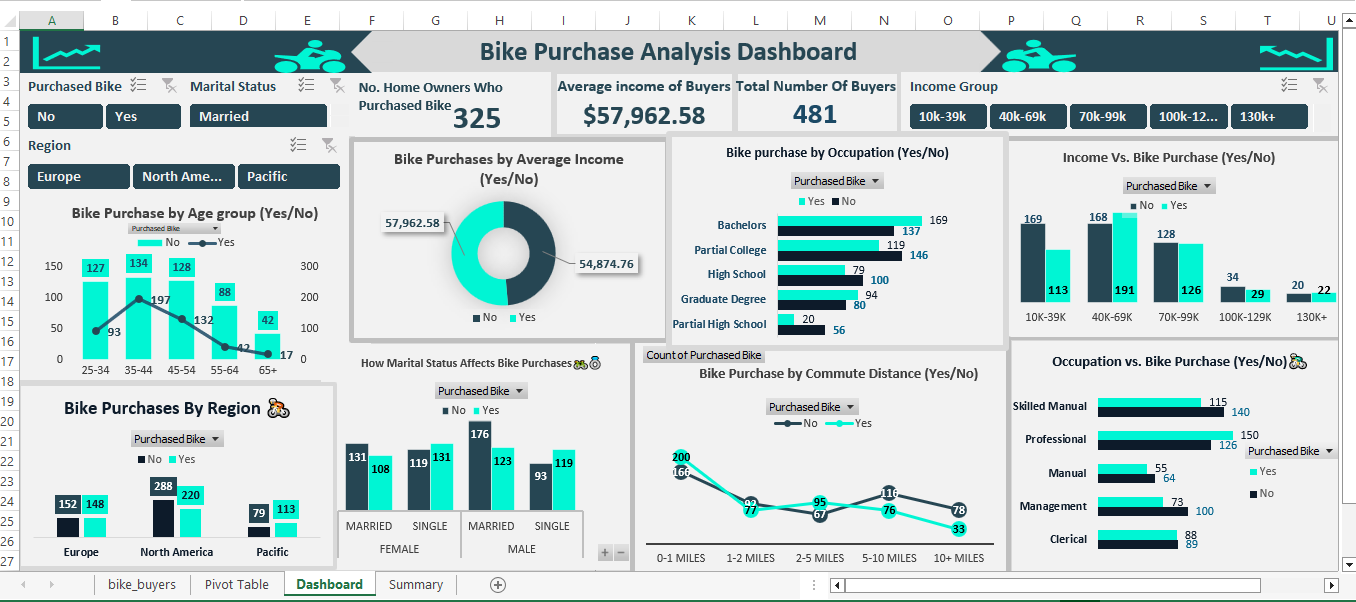
Purchase Trends: Who is Buying and Why? - an interactive Excel dashboard that analyzes purchase behavior across age, gender, car ownership, income groups, marital status, trip distance, and number of children.
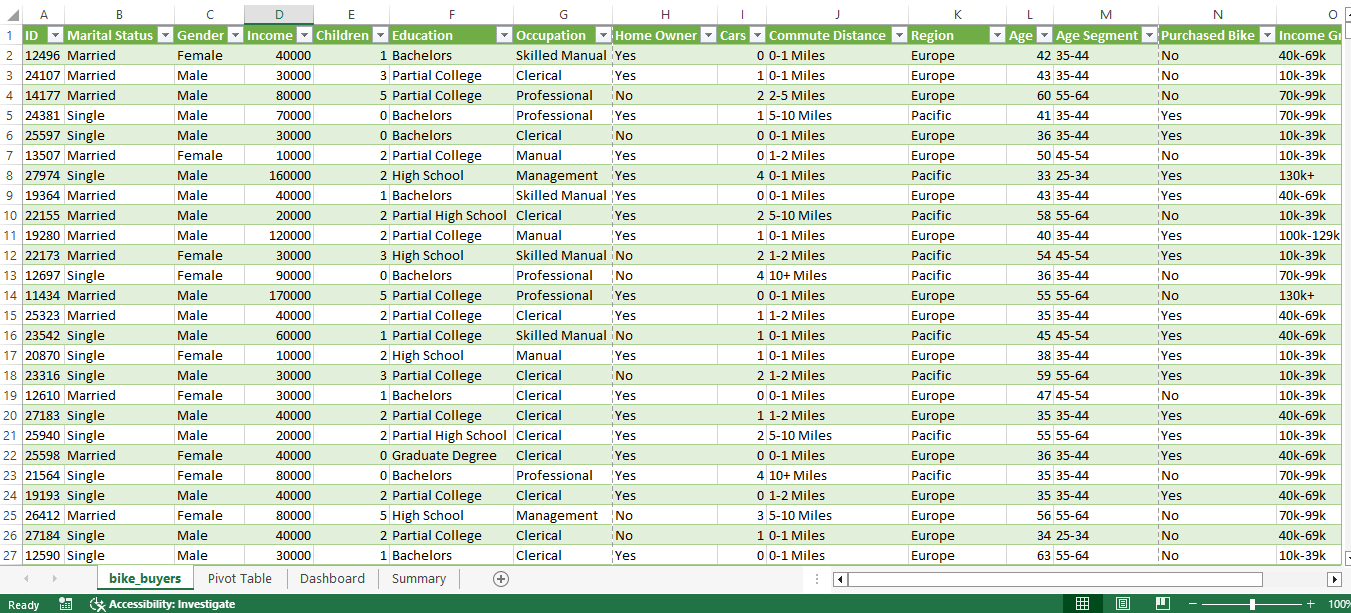
I prepared the dataset with Power Query (Get & Transform), modeled it with Excel Tables (and the Data Model/Power Pivot where needed), and built KPI cards and visuals with PivotTables/PivotCharts, Slicers, and timelines. The report highlights average buyer income and total buyers, then lets the viewer segment the results in one click to see how demographics and travel behavior influence bike ownership. The layout uses a clean teal accent and icons to keep the story clear and decision-focused.
Key Features
Demographic Segmentation
Analyzes buyer profiles by key demographics, including age, income level, marital status, and education, to identify the most likely customers.
Behavioral Insights
Provides a deeper look into buyer behavior by analyzing purchase decisions based on occupation and commute distance, helping to create more targeted marketing strategies.
Dynamic Filtering & Regional Analysis
Allows users to instantly filter the entire dashboard by marital status and region to explore and compare sales trends across different markets.
Visual Trend Analysis
Uses a variety of chart types, including bar charts and line graphs, to clearly visualize the relationship between multiple variables and their effect on bike purchases.