Portfolio Details
Project Information
- Category: Data Analytics / Excel Dashboard
- Client: Self-Directed Project
- Project date: March, 2025
- Project URL: View live dashboard
Project Overview
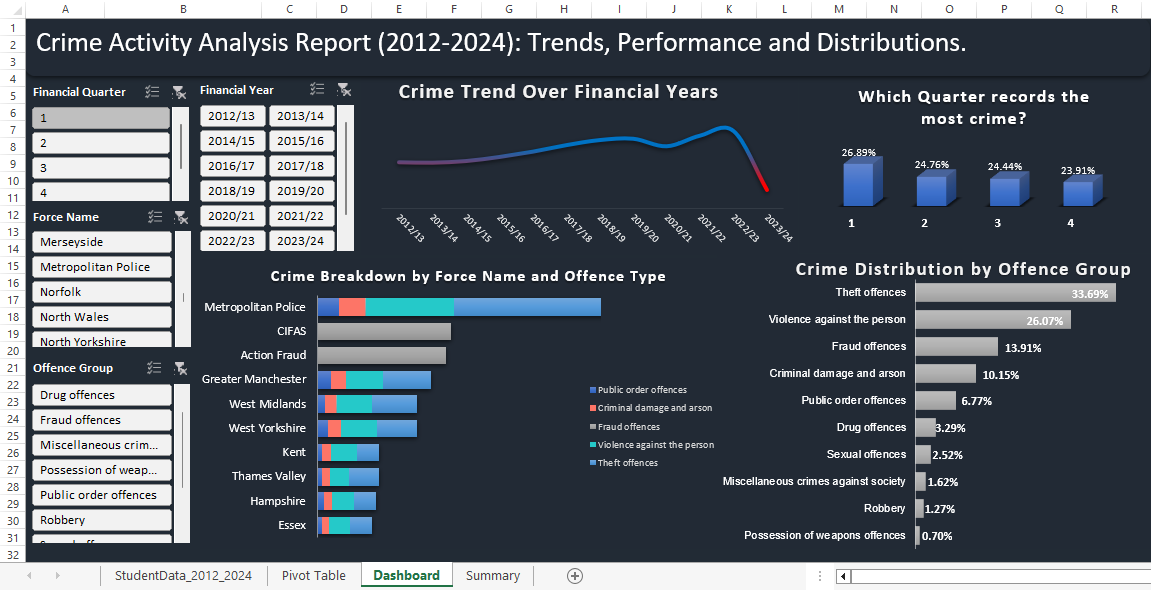
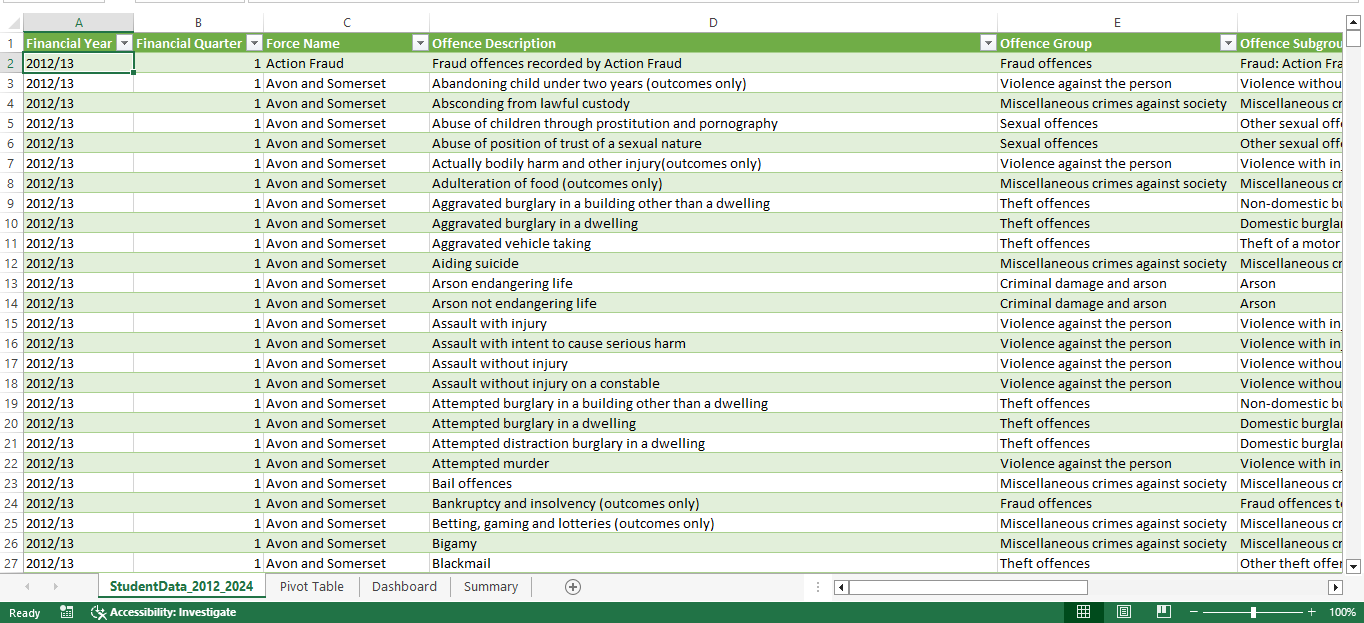
This "Crime Activity Analysis Report (2012-2024)" is an interactive Excel dashboard created to analyze a large dataset of crime activity over a 12-year period. The project's goal was to transform raw data into a clear and intuitive reporting tool that provides key insights into crime trends, performance by police force, and the distribution of various offense types. This was accomplished by using Power Query to efficiently append and clean the 12 years of data, which was then used to build dynamic charts with Excel's PivotTables and Slicers for a data-driven understanding of crime patterns.
Key Features
Dynamic Trend Analysis
Provides a high-level view of crime trends over a 12-year period, allowing for easy identification of long-term increases or decreases in activity.
Interactive Drill-Down
Allows users to segment the data by Financial Year, Financial Quarter, Police Force, and Offense Group for a granular, on-demand view of specific data subsets.
Performance & Distribution Analysis
Highlights key metrics such as the crime distribution by offense group and compares the performance of different police forces, providing a clear breakdown of activity.
Actionable Insights
Offers immediate answers to key questions, such as which quarter records the most crime and which crime types are most prevalent across different jurisdictions.